The Gantt view graphically represents the chronological sequence of activities in the form of bars on a time axis.
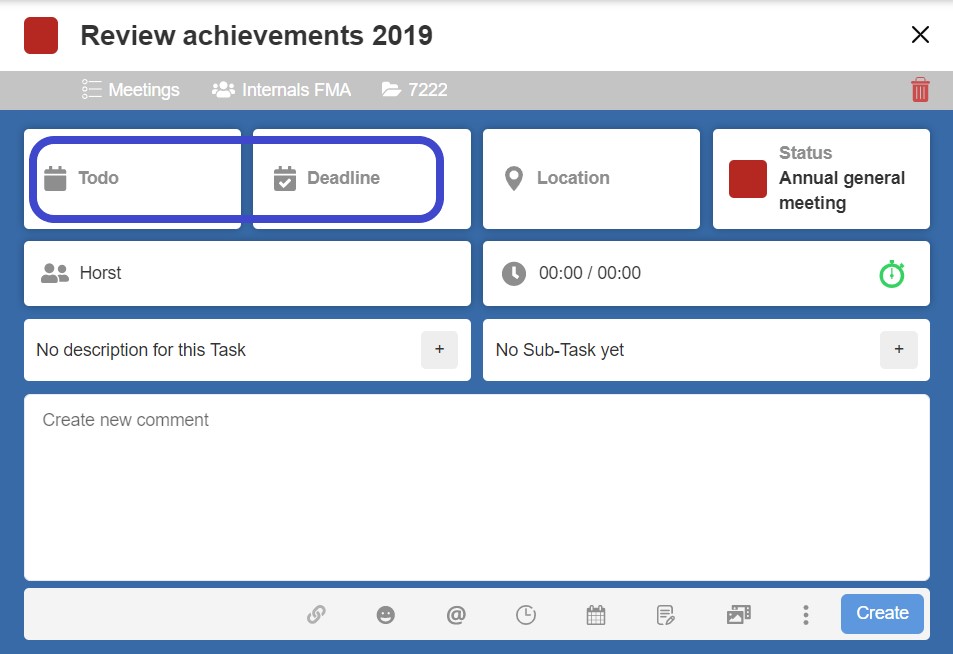
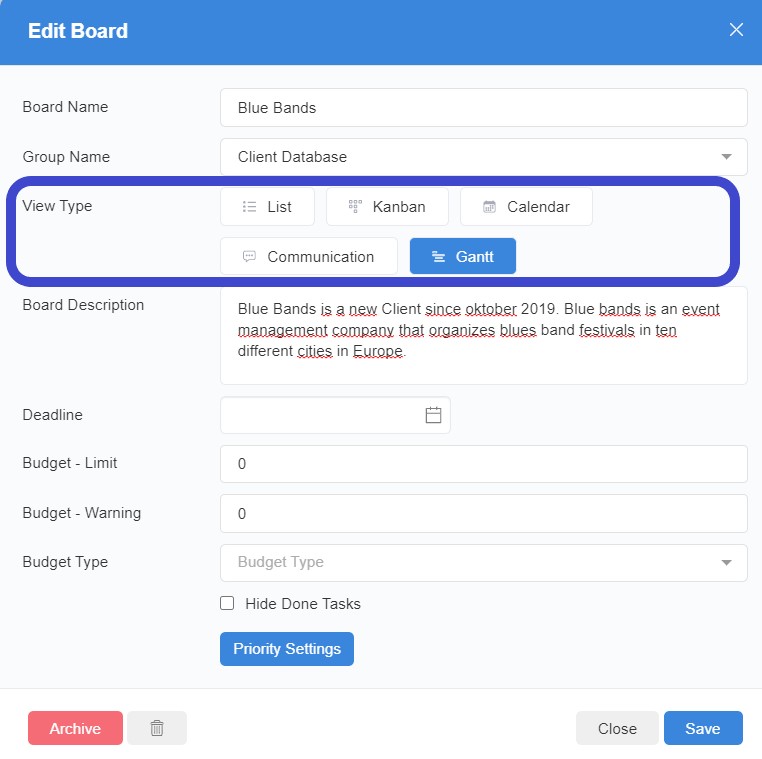
2. Select the Gantt view in the board settings
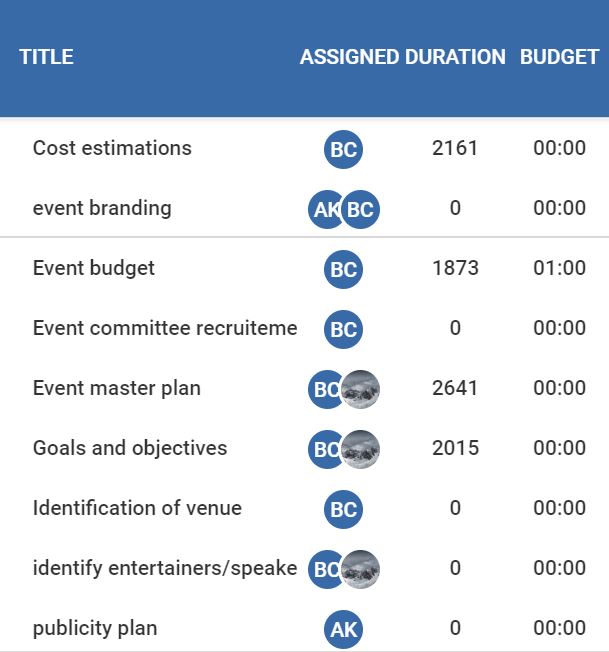
3. The tasks are ordered among themselves. The start date and the agent are also shown here
4. On the left side you can see the Gantt chart with its chronological sequence
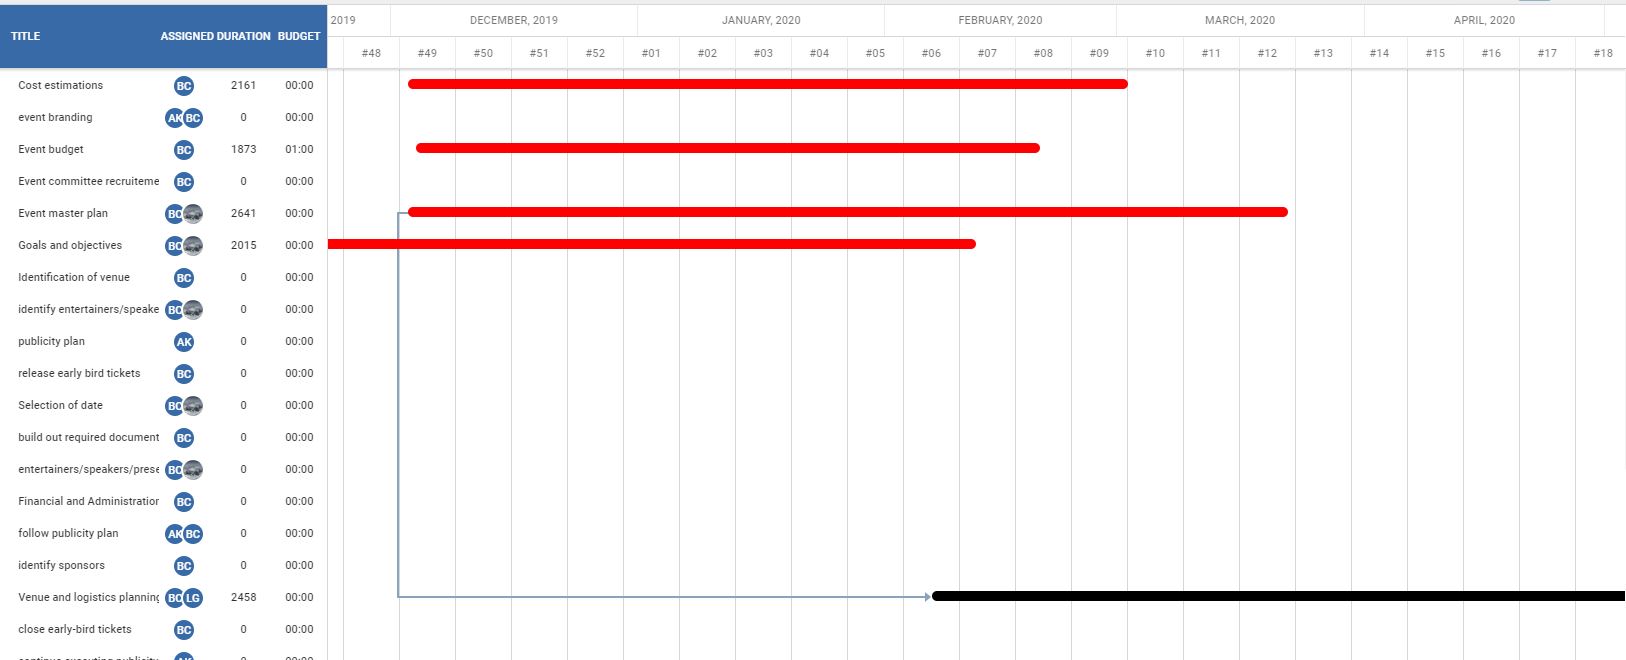
Here you can show dependencies. The grey line means, that you have to start with the red task BEFORE you start the black task.
5. Tasks can be moved and adjusted directly in the timeline
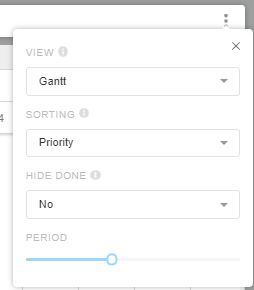
6. Over the settings (click on the gear wheel in the upper board menu bar) you can make the following individualizations:
